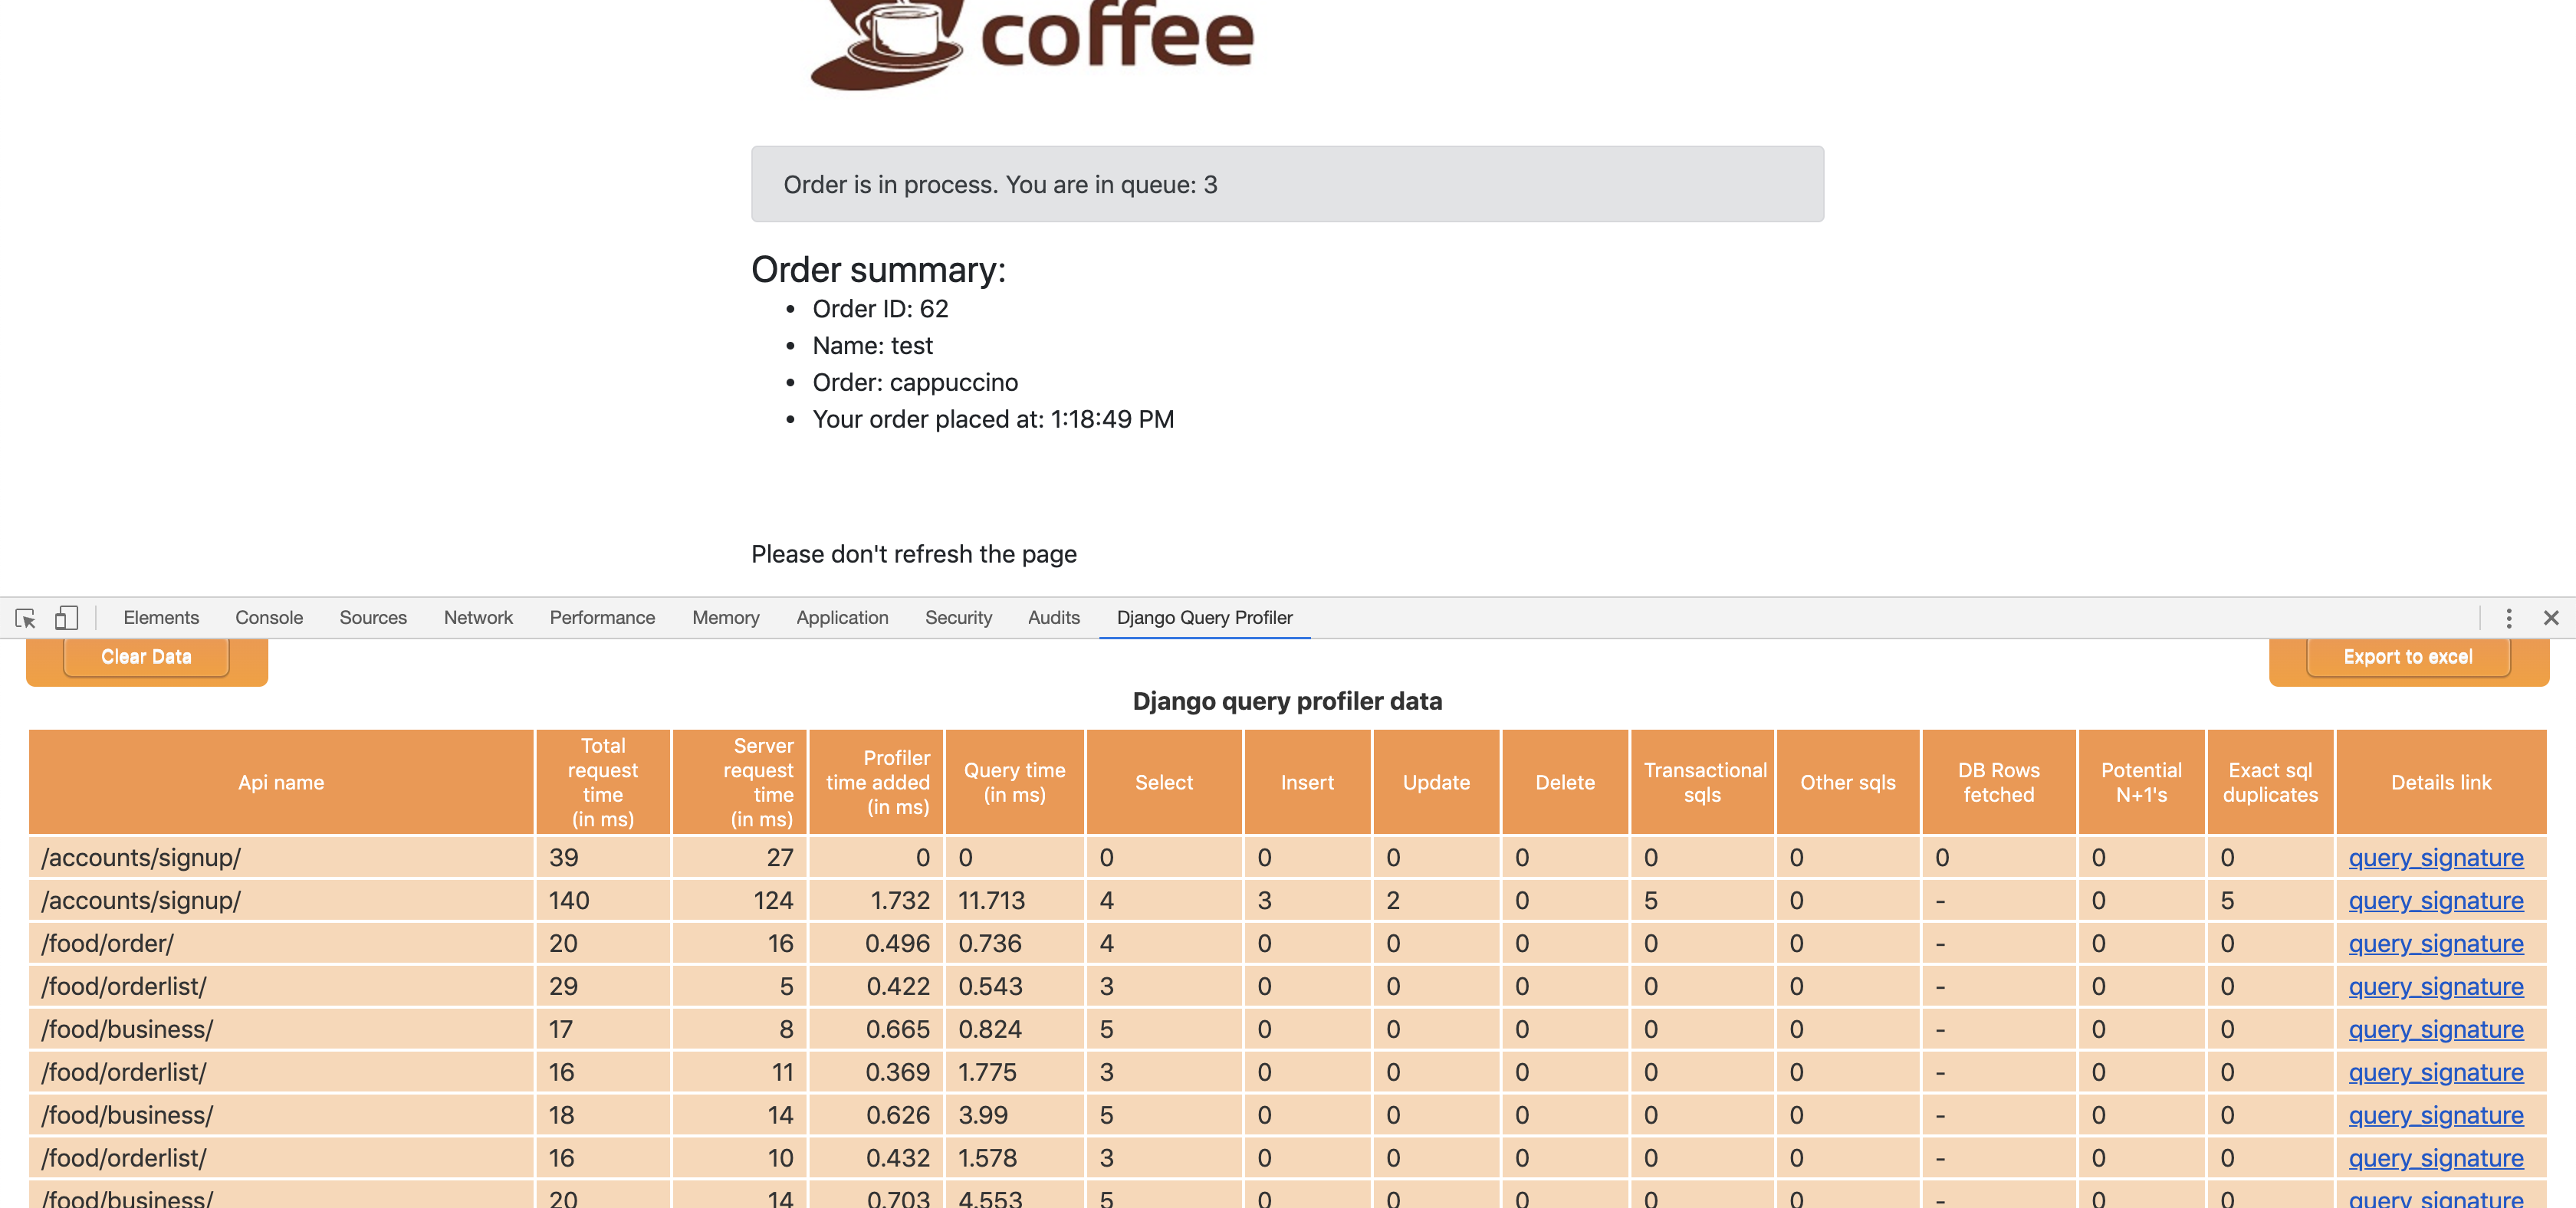
columns in chrome plugin

There are 15 columns in the chrome plugin table:
- Api name: This is the api name that we see in the network tab in chrome devtools
- Total request time (in ms): This is the total round-trip time of the request. This is also the same as what chrome network tab shows for that api
- Server request time (in ms): This is the time the request spends on the server - assuming that the django-query-profiler middleware is the first one in the list.
- Profiler time added (in ms): This is the overhead added by profiler to the request
- Query time (in ms): This is the total time taken by all queries for that request
- Select: Count of select sqls
- Insert: Count of insert sqls
- Update: Count of update sqls
- Delete: Count of delete sqls
- Transactional sqls: Count of begin/end transaction sqls
- Other sqls: Count of sqls that we were not able to classify as above five. Ideally this should never happen
- DB Rows fetched: Count of database rows that the select queries fetch from database. Note that sqlite does not return number of rows fetched, so it would show up as ‘-’
- Potential N+1’s: This represents the count of N+1 queries that the profiler found. If this number seems high, the API is definitely something that should be optimized.
- Exact sql duplicates: This represents the count of queries which had the same (query, param) but was executed multiple times to the database. If this number is higher, consider doing query caching, or pulling the sql out of the loop
- Details link: This is the url that would show a detailed view, and the recommendation on how to fix the code path